News
The pandemic and its impact on TEC Member energy usage – The Recovery
The pandemic and its impact on TEC Member energy usage – The Recovery
In September 2020 we reviewed the impact of the early stages of the pandemic and the various lock-downs on energy usage via the TEC frameworks SHOWN HERE. The impact was marked, although perhaps not as dramatic as it may have in terms of total demand reduction on estates which were largely unoccupied when students were sent home for the first lockdown.
Now we have seen the return of students to campuses and operations restarting, we can look at the impact on energy usage of operating estates in Covid-safe mode from August to December, starting with electricity.
TEC Portfolio Electricity Usage by Month – 2019 v 2020
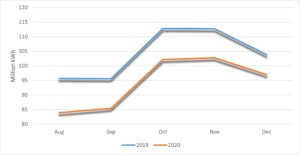

The months from August to December have seen a gradual “recovery” in demand versus 2019 levels, with August being a little over 12% below previous year’s levels (on a like-for-like basis), and to just 6.6% below for December 2020.
In more detail, December 2020 saw a longer “tail” of consumption into the Christmas holidays compared to the previous year, with consumption at or above that of December ‘19 once we reached 20th December ‘20. This should perhaps be unremarkable since sites were in “normal” holiday mode. Over the entire August to December 2020 period total electricity usage was only 9.5% lower than the same period in 2019.
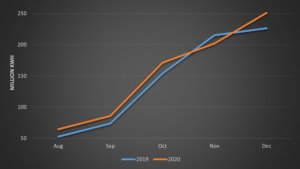
In considering gas, again the usage data shows an opposite trend. Usage in August to December 2020 compared to the same period in 2019 was 7% higher. Data by month trended a little opposite to electricity, with usage 22% higher in August ‘20 compared to ‘19, settling down to 11% higher in December.
Of course with gas we need to consider the impact of weather, both in 2020 and 2019. Higher demand in August and September 20 is particularly surprising given that these 2 months were warmer than seasonal normal temperatures and demand should have been lower. Things cooled down in October and saw demand anticipated at 5% and 12% above seasonal normal levels, so perhaps the corresponding increases should have been less of a surprise, although November ‘20 bucked the trend as demand was down 6% on 2019, perhaps caused as much by higher than anticipated demand versus seasonal normal due to a cold November in 2019.
That being said there was evidence from conversations with members that buildings were being operated with heating switched on but with additional natural ventilation. This will of course have seen higher consumption although again reports were that buildings were a little cooler than would have been the case under normal operations. Increased gas usage in buildings which will have been cooler than in a normal winter tells its own story in the assessed impact of operating estates during a pandemic.
TEC Portfolio Gas Usage by Month – 2019 v 2020

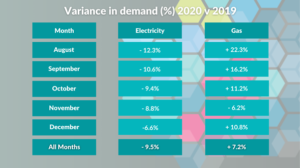
Differences in TEC portfolio demand (2020 v 2019) by month can be seen in the table below:

It is worth re-iterating that TEC frameworks have no penalties for under or over consumed volume for either gas or electricity, penalties which are often charged elsewhere under so-called “take-or-pay” contract conditions. Avoidance of these penalties is just another advantage of using TEC’s aggregated flexible frameworks.
Once we reach the end of March and have further data, we will take another look at the impact of the latest lock-down and complete a full year of Covid-safe estates operations, so keep an eye on the TEC website for further updates.